Steam Now Shows Average FPS for Games on Steam Deck, and the Number Needs Context
By AS Gaming EditorialNovember 22, 20265 min readPC
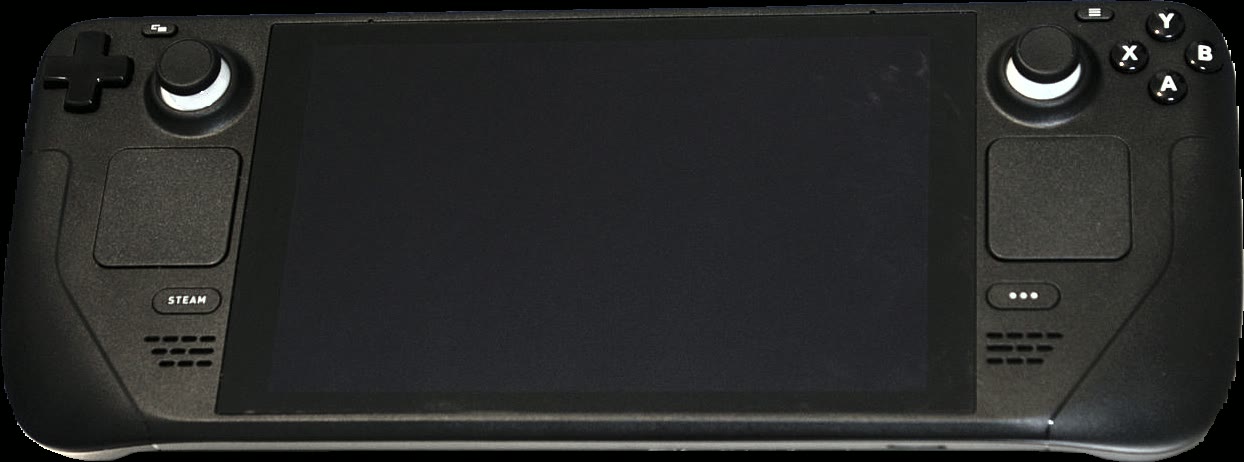
Source: Liam Dawe / GamingOnLinux, CC BY-SA 4.0, via Wikimedia Commons
Steam now shows average FPS for games on Steam Deck, right on the store page, before you buy. Valve announced the feature on November 9 and it went live on November 10, and it is the most useful thing to happen to Steam Deck shopping since the Verified badge. The catch is that the number on its own can mislead you. The histogram next to it is the part that actually tells the truth.
The data sits in the Steam Deck Compatibility section of a game's store page, the same spot that carries the Verified, Playable or Unsupported badge. Click Learn more there and you will see the average frame rate reported by other Deck owners, plus an expandable histogram showing how often the game runs at each frame rate. Thousands of games already have data, and the number grows as more players contribute.
Where to find Steam Deck average FPS
Open any game that has been tested for Steam Deck compatibility and has enough player data, and the figure is waiting under the compatibility badge. The average is the headline, but the histogram is the useful part. It shows the distribution: what share of recorded play hit 30fps, what share hit 60, and where the hitches and stutters live as small columns at the lower frame rates.
The figures also appear in the Steam library for players on the Steam client beta. Coverage is broader than the Verified list: the data applies to games that went through verification whether they landed as Verified, Playable or Unsupported, so even a game with a rough compatibility rating can now show you exactly how rough.
How Valve builds the number
The data comes from Steam Deck owners who opted in to share anonymized frame rate information while they play. Valve says a majority of Deck players have opted in, which is why thousands of games already have figures. Only sessions running at the default frame limit are counted: 60fps on the original LCD Deck and 90fps on the OLED model. Idle time and invalid samples are filtered out.
That filtering matters, because it keeps the data comparable. A game is not being judged on a session where someone left it running on the pause screen, or on a Deck with a custom frame cap. But there are limits Valve is open about. The data does not account for custom in-game graphics settings, so each figure mixes players running different settings. A game will only show data once it passes a minimum number of anonymous data points, so newer or niche games may not have it yet.
The VSync trap: why the average can mislead
Here is the part that makes the histogram essential. On the Steam Deck OLED, the screen refreshes at 90Hz. When a game cannot hold 90fps with VSync on, it does not drop to 89 or 85. It drops to the next clean divisor of the refresh rate, which is 45fps, and then climbs back to 90 when the load eases. The result is a game that bounces between 90 and 45 and almost never actually runs at the average.
Valve's own example makes the point: a pattern of 90, 90, 45 averages out to 75fps, a number the game never actually produces. The same effect shows up in real games. Skyrim on the OLED runs at 90fps about 35 percent of the time and at 45fps about 63 percent of the time, with the rest down at 30. The average would tell you something in the middle. The histogram tells you the game spends most of its time at half its target frame rate.
The lesson is simple: read the histogram's peaks, not the headline average. Two peaks far apart usually mean VSync stepping, not stuttering. A long tail of low frame rates is the real warning sign.
What the early numbers say
The launch figures give a good sense of the range. Final Fantasy VII Rebirth averages 37fps on the OLED model. Hades II averages 88fps on the same hardware, which is about as good as it gets. The Elder Scrolls IV: Oblivion Remastered averages 33fps on the LCD Deck, with its histogram weighted heavily at 30fps and a spike at 60. Elden Ring sits at 42fps on OLED and 38fps on LCD.
Those numbers will drift over time as more players contribute data and as games get patched, so treat them as a snapshot rather than a verdict. But they already answer the question Deck owners actually ask before buying: will this game run well on my hardware, and if not, how bad is it really?
Why it matters
The Verified badge was always a blunt instrument. It tells you a game runs, not how well it runs, and a Playable rating can cover anything from minor text issues to a slideshow. Average FPS and histograms add the layer that was missing: real-world performance data from real players, on the same hardware you own.
Valve says this is the first step and plans to expand the reporting beyond the Deck, which points toward the same data eventually appearing for the Steam Machine and other SteamOS devices. For now, the advice is straightforward. Before you buy a game for your Deck, check the compatibility section, open the histogram, and look at where the bars actually sit. The average is a summary. The shape of the data is the answer. For more on Valve's hardware, our Steam Machine review after four months covers the company's bigger living-room box, and our Acer Shadow Knight G710 tablet looks at a handheld from the other side of the market. The source for the figures in this article is Valve's announcement, covered in detail by TweakTown.